King tides, warming oceans and El Niño could lift California water levels more than four feet this winter, with storm waves adding further coastal damage.
California’s coastal flood risk this winter comes from several forces arriving together: unusually high tides, a marine heatwave, long-term sea level rise and a strong El Niño. Tropical Storm Rachel offered an early warning in October, when waves damaged oceanfront homes in Long Beach and residents were evacuated. For several days, water levels ran 1.6 feet above predicted tides, nearing Los Angeles County records. Storm waves then struck on top of that elevated water.
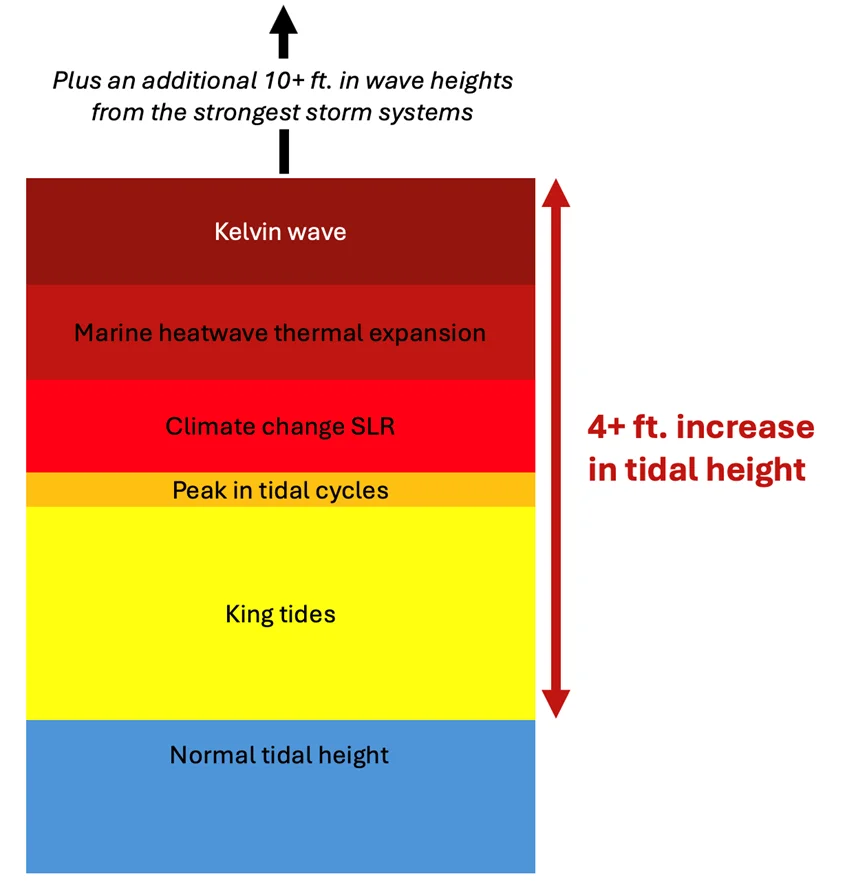
My read is that the danger lies in how these factors stack. Some are predictable parts of natural cycles; others reflect a warmer climate. Together, they could push water levels more than four feet above normal in parts of California this winter, before storm waves are counted. The effects are already visible in eroding beaches, damaged infrastructure and homes threatened by the sea.
High tides arrive alongside longer cycles
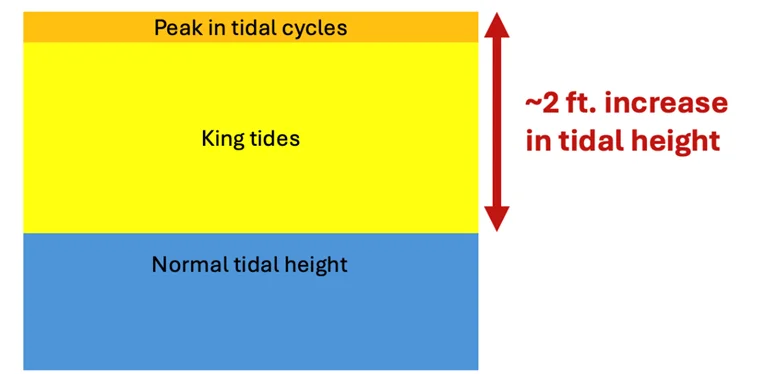
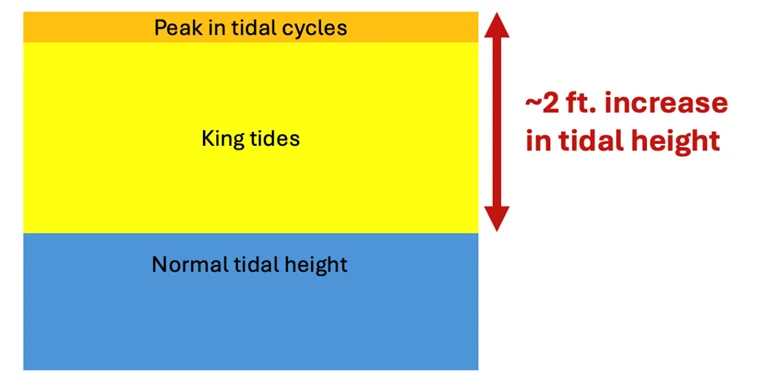
King tides occur when the Earth, moon and sun align, producing the highest tides of the year. They typically add about one to two feet to average high tides. This fall and winter, those annual peaks coincide with two longer tidal cycles, which reach their high points every 4.4 and 18.6 years.
Patrick Barnard of UC Santa Cruz estimates the overlapping cycles could add another two to four inches to sea levels this winter. The strongest high tides are expected around Thanksgiving, Christmas and Martin Luther King Jr. Day, aligning with successive full moons. Those dates give coastal communities a practical marker for periods when high water may be especially disruptive.
Climate change has lifted the starting point
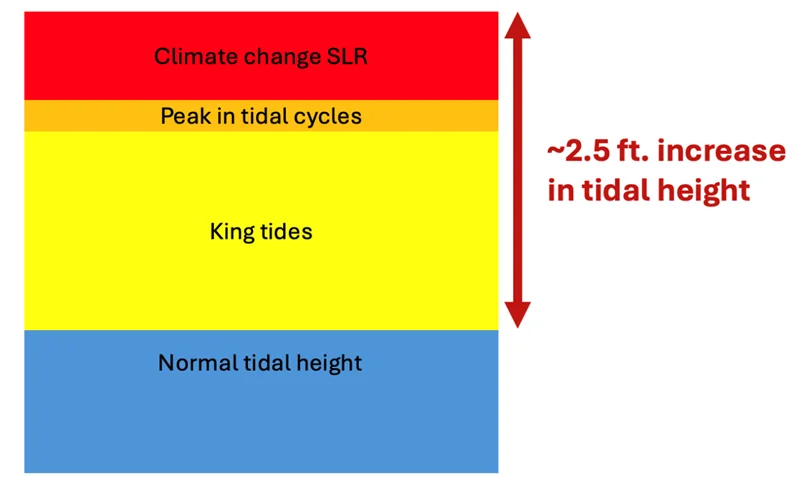
High tides and El Niño are playing out against a higher baseline than they would have a century ago. Oceans have absorbed about 91% of the extra heat added to the climate system by fossil fuel emissions. That warming raises sea levels in two main ways: warmer seawater expands, and melting glaciers and ice sheets add water to the oceans. Ice loss has recently become the leading source of sea level rise.
Combined, these processes raised global sea levels by about eight inches, or 20 centimeters, between 1901 and 2020. California’s coast, from San Francisco to La Jolla, has also seen about eight inches of rise over roughly the past century. That background increase means a high tide or storm surge now begins from a more elevated level. Research has also linked fossil fuel emissions to this continuing rise.
A marine heatwave adds local pressure
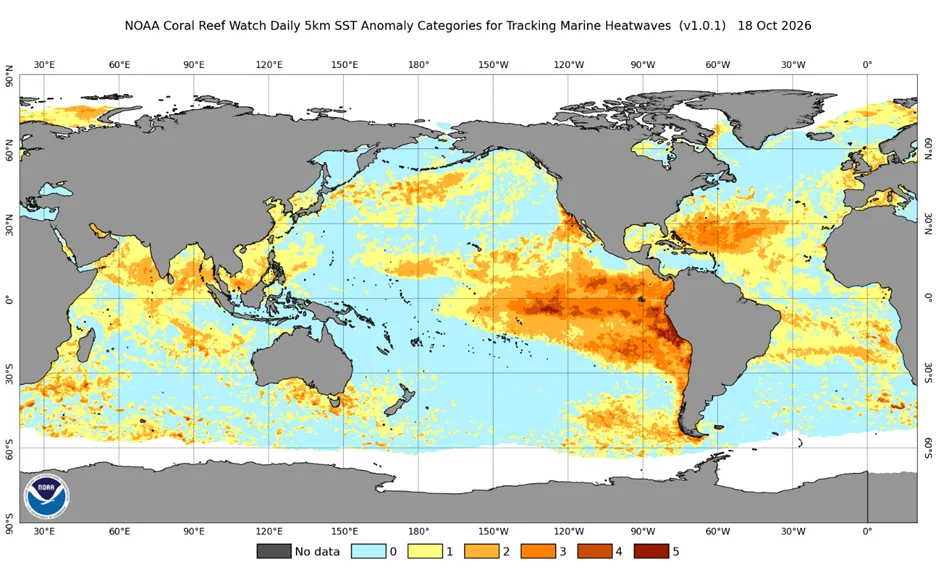
Off California, a marine heatwave has persisted since earlier this year. NOAA’s Marine Heatwave Watch classifies the conditions off Baja California and central and southern California as Category 4, or “extreme.” The same basic physics driving long-term ocean expansion applies here: warmer water takes up more space, raising local sea levels beyond the global background increase.
Estimates put the heatwave’s contribution at six to as much as ten inches above a normal tide. That’s in addition to the roughly eight inches of long-term sea level rise along the California coast. These estimates describe different contributors to water height, and their effects can overlap with the tidal and El Niño conditions unfolding at the same time.
El Niño sends additional water toward the coast
El Niño can raise California coastal water levels by roughly six to twelve inches through Kelvin waves. These are broad movements of water beneath the surface, not the towering waves associated with storms or tsunamis. When equatorial Pacific winds weaken, water that normally piles up near Indonesia can move back east across the ocean.
When that water reaches South America, part of the movement turns north along the Central American and North American coasts. The resulting bulge raises sea levels as it travels. One Kelvin wave reached California earlier this month, helping create the elevated water levels that met Rachel’s storm waves. The source article reports that three or four more are expected before this El Niño ends later in winter.
Kelvin waves also carry warm tropical water north. That can strengthen the existing marine heatwave and produce further expansion, while adding the volume of water transported toward the coast. The warming may persist after an individual wave passes, and later waves can build on it.
Storm waves turn high water into coastal damage
King tides, overlapping tidal cycles, long-term sea level rise, the marine heatwave and Kelvin waves could combine to put California water levels more than four feet above normal this winter. Each factor can contribute to coastal flooding on its own. Their alignment raises the stakes, particularly when high tides or a peak Kelvin wave coincide with severe weather.
El Niño can shift the jet stream over California, steering more storms and rainfall toward the Southwest. Some storms, including those associated with the Pineapple Express, can generate waves over ten feet high. In the strongest storms, wave heights can exceed that level; waves then strike on top of already elevated water, increasing the potential for flooding and erosion.
The risk also reflects a changing pattern of coastal hazards. A 2023 study found that intense storms producing waves taller than 13 feet occurred twice as often from 1996 to 2016 as from 1949 to 1969. Since 1900, human-caused sea level rise has quadrupled the frequency of coastal flooding events, according to another study. Research also suggests that El Niño events may be growing more intense as the climate warms, with consequences for the strength of coastal Kelvin waves.
Preparation depends on timing and exposure
The next useful signals are the timing of high tides, the progress of Kelvin waves and the arrival of major storms. The California Institute for Water Resources and Listos California have assembled a dashboard of resources for tracking El Niño conditions and planning. For shoreline communities, the practical concern is the compound effect: elevated water can make waves more damaging, and repeated events can leave less time for beaches and infrastructure to recover.
The threat won’t fall evenly across communities. Households with lower incomes and communities of color are often more seriously affected by climate impacts, according to California’s climate assessment. Long Beach’s damaged homes show how quickly elevated water and wave action can translate into immediate losses. This winter’s high water will offer another test of how well exposed communities can prepare for a coast where the baseline keeps rising.
Natural cycles still shape California’s tides and El Niño seasons, but fossil fuel driven warming has changed the conditions in which they occur. The clearest takeaway is operational: watch the overlap of high tides, warm water, Kelvin waves and storms, because the most damaging coastal conditions are likely when those signals converge.

Discussion
Sign in to join the discussion.